Quick answer
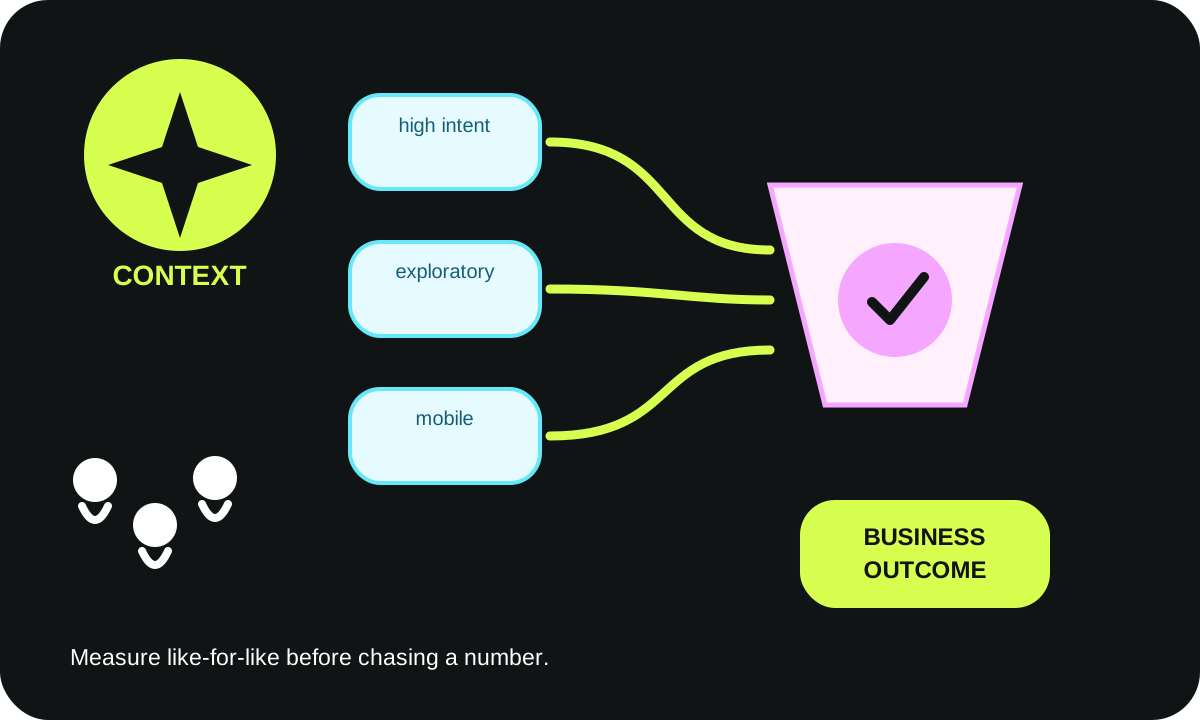
Do not chase a generic industry percentage. First define who is eligible, what action counts, and which funnel step you are measuring. Then compare like-for-like source, intent and device segments. Use the calculator to model the arithmetic consequence of a possible rate change, not to predict uplift; validate changes with disciplined experiments and guardrails.
Last reviewed: 2026-09-19T12:20:00.000ZRevenue-impact scenario calculator
Enter your own eligible traffic or leads, observed conversion rate, modeled conversion rate, average order/deal value and margin. The defaults are illustrative placeholders only—not market benchmarks. Results are arithmetic scenarios, not promised uplift.
1. Conversion scenario across traffic checkpoints
Takeaway: the gap scales with your eligible volume only because the modeled rate is applied consistently to your own traffic input.
2. Baseline vs modeled revenue
Takeaway: revenue follows conversions × your average order/deal value; no extra uplift assumption is added.
3. Modeled revenue composition
Takeaway: margin changes the economic value of a conversion without changing the conversion count itself.
Scenario table generated from your inputs
| Measure | Current | Modeled | Difference |
|---|---|---|---|
| Conversion rate | 2% | 2.5% | 0.5 pp |
| Conversions | 200 | 250 | 50 |
| Revenue | $40,000 | $50,000 | $10,000 |
| Gross profit | $20,000 | $25,000 | $5,000 |
Important: this calculator does not estimate causality or probability. A modeled conversion rate is a planning assumption until a valid experiment or other evidence supports the change.
Tables built for the buying decision
Primary decision table
| Friction hypothesis | Page / step | Change | Primary metric | Guardrail | Effort | Confidence |
|---|---|---|---|---|---|---|
| High-intent visitors cannot find implementation proof near the decision point | Pricing / service CTA | Place relevant case/security/implementation proof beside CTA | Qualified CTA completion | Lead quality / sales acceptance | Medium | High when recordings, sales notes and page behavior point to the same doubt |
| Mobile form completion is hurt by input/validation friction | Lead form | Improve input types, autofill, error placement and keyboard flow | Qualified form completion | Spam/unqualified rate; error rate | Medium | High when mobile error and abandonment evidence is consistent |
| Checkout uncertainty appears at shipping/returns step | Checkout | Clarify shipping timing, returns and total-cost expectations before payment | Purchase completion | Revenue per eligible session; cancellations/refunds | Medium | Medium until qualitative evidence confirms the concern |
| Exploratory visitors receive a CTA that assumes purchase readiness | Educational landing page | Offer a stage-appropriate next step before the sales CTA | Meaningful next-step completion | Downstream qualification / unsubscribe or bounce quality signals | Low | Medium when traffic intent is clearly exploratory |
| Pricing visitors cannot understand plan fit quickly | Pricing | Rewrite plan boundaries and decision criteria; reduce ambiguous feature language | Qualified plan/CTA progression | Support contacts; wrong-plan cancellations | Medium | Medium; strengthen with sales/support evidence |
| Page performance delays first useful interaction on mobile | High-traffic landing page | Reduce heavy media/scripts and defer non-critical third parties | Target-task completion for mobile segment | Core performance/error indicators; engagement quality | High | High when field performance and interaction timing show the constraint |
| A long B2B form asks for fields sales does not use | Demo request | Remove or defer non-essential fields while preserving qualification needs | Qualified submit rate | Sales acceptance and missing-data burden | Low | High after CRM/sales field audit |
| Users reach an error but cannot recover | Form / checkout error state | Make error cause, field location and recovery action explicit | Successful recovery / completion | Repeat error rate; support contacts | Low | High when error logs and recordings reproduce it |
Segmented measurement plan
| Segment | Recommended denominator | Primary outcome | Guardrail | Interpretation question |
|---|---|---|---|---|
| High-intent pricing/service visitors | Eligible sessions reaching the decision page | Qualified CTA or purchase completion | Lead quality / revenue per eligible session | Did the experience help already-qualified demand act? |
| Exploratory content visitors | Eligible content sessions in the intended topic set | Relevant next-step progression | Unsubscribe, low-quality leads or pogo behavior as applicable | Did we create a useful next step without forcing sales intent? |
| Paid search | Sessions from the defined campaign/source scope | Campaign-aligned conversion | CPA/revenue quality outside the page where available | Is page performance being confused with campaign mix? |
| Organic non-brand | Comparable landing-page sessions | Intent-aligned progression | Engagement and downstream quality | Are informational and commercial queries being blended? |
| Mobile | Eligible mobile sessions within comparable source/intent | Task completion | Errors, performance, accidental exits | Is device friction present after controlling for traffic mix? |
| Desktop | Eligible desktop sessions within comparable source/intent | Task completion | Quality/revenue metrics | Does the apparent device gap remain within like-for-like traffic? |
Sources and assumption boundaries
Fast-changing platform, pricing and search claims were reviewed on 2026-09-19T12:20:00.000Z. Interactive scores and scenarios are clearly labeled planning models, not sourced market benchmarks.
- Google Analytics Help — Scopes of traffic-source dimensions Official guidance on user-, session- and event-scoped traffic-source dimensions; reviewed September 19, 2026.
- Google Analytics Help — Traffic acquisition report Official definitions for session acquisition dimensions and traffic reporting context; reviewed September 19, 2026.
- Google for Developers — Measure ecommerce Official GA4 ecommerce measurement guidance, including purchase value and currency fields; reviewed September 19, 2026.
- Optimizely Support — Primary, secondary metrics and monitoring goals Official experimentation guidance on primary, secondary and monitoring metrics; reviewed September 19, 2026.
- Optimizely Support — Guardrail alerts Official guardrail-alert documentation updated August 12, 2026; used for experiment safety context, not benchmark claims; reviewed September 19, 2026.
Turn this planning result into a scoped review.
Send the assumptions, constraints and result summary. WebDesignK can review the architecture/content/implementation boundary, identify missing discovery inputs and return a prioritized next-step scope.
- Bring: current site/product, constraints, integrations and your tool result.
- You get: a scoped recommendation, open questions and implementation priorities.
Decision snapshot for What Is a Good Website Conversion Rate Benchmarks and Context
A good website conversion rate is not a universal percentage. It is a rate with a precisely defined numerator and denominator that produces acceptable business economics for a specific audience, offer, funnel step and traffic source. Use outside benchmarks only as orientation, never as a target detached from your own baseline. The practical question is whether a well-measured segment can improve without harming revenue quality, margin, retention, accessibility or other guardrails.
What you’ll learn / decide: define the conversion that actually matters, establish a trustworthy baseline, separate intent and device segments, rank friction hypotheses, design experiments with guardrails, and model the economic consequence of a possible rate change without treating that model as a forecast.
The most important tradeoff is speed versus validity. Teams often want a quick benchmark, but a blended sitewide percentage can hide acquisition mix, mobile friction, low-quality leads or a checkout problem. A slower baseline-first process gives you a number you can actually act on.
Define the visitor decision and business outcome
“Conversion rate” only becomes useful after you define who was eligible to convert, what counted as a conversion, and at which step you are measuring it. An ecommerce purchase rate, a B2B qualified-demo rate and a SaaS trial-to-paid rate answer different questions. Even within one business, homepage-to-form-start, form-start-to-submit and qualified-lead-to-opportunity rates diagnose different constraints.
A clean metric definition has four parts:
- Population: the eligible users, sessions or opportunities in the denominator.
- Outcome: the event or state change in the numerator.
- Window: the period in which the outcome can reasonably occur.
- Quality rule: whether every submit counts or only outcomes that meet a business qualification threshold.
Google Analytics distinguishes user-, session- and event-scoped traffic-source dimensions, which is a useful reminder that denominator choice changes interpretation. If you report a session conversion rate, keep the denominator session-scoped; if your sales process measures qualified accounts, do not pretend a raw form-submit percentage is the same business outcome.
Write the metric in plain English before opening a dashboard
A useful statement sounds like: “Among U.S. non-customer sessions that reached the pricing page from paid search, what percentage submitted a demo request that sales later marked qualified?” That wording exposes the population, page, source and quality condition. It also makes instrumentation gaps obvious.
For ecommerce, purchase events should carry value and currency so the team can compare rate with revenue rather than optimizing order count in isolation. Google’s GA4 ecommerce guidance documents the purchase event with transaction value, currency and item data. The point is not that GA4 defines your strategy; it is that the data contract should preserve the economic outcome you intend to optimize.
Capture the baseline before changing anything
Before changing copy, layout, forms or checkout, capture the current state with the same metric definition you plan to use later. A baseline is not “last month’s conversion rate” by default. It is an observation period with known instrumentation, known traffic composition and known funnel eligibility.
Start by checking event firing, duplicate events, consent effects, internal traffic, bot filtering, checkout redirects and CRM reconciliation. Then record the baseline by the segments most likely to behave differently: source/medium, campaign, device class, new versus returning visitor, geography when commercially relevant, and high-intent versus exploratory landing paths.
A useful baseline packet includes:
- eligible sessions or users;
- conversion count and conversion rate;
- revenue or qualified-pipeline value when available;
- device and source mix;
- important funnel-step rates;
- form errors, checkout failures or technical exceptions;
- lead-quality or refund/cancellation indicators;
- notes about campaigns, promotions, outages or tracking changes.
Do not compare a promotion-heavy week with a quiet period and call the difference a design effect. Do not compare desktop-heavy branded traffic with mobile-heavy prospecting traffic without segmentation. The baseline must be comparable enough that a later change has a meaningful reference point.
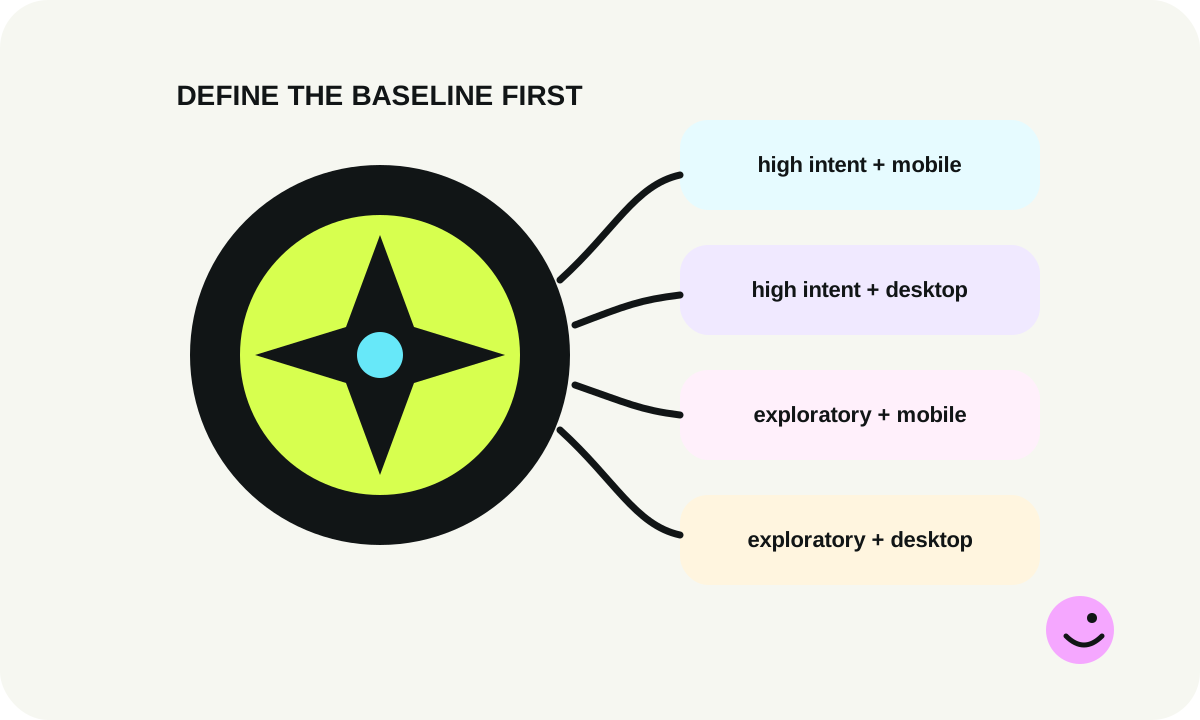
Why industry benchmark tables are weak targets
Published benchmark studies can be useful for vocabulary and rough orientation, but they frequently mix different industries, traffic sources, offers, definitions and attribution windows. A “2% conversion rate” could mean purchases per session, leads per user, checkout completion or something else entirely. Treat external numbers as questions to investigate, not proof that your site is healthy or broken.
Your stronger benchmark is usually your own stable, segmented baseline plus the economics of the outcome. If one segment converts less but produces much higher-value customers, optimizing only the blended rate can make the business worse.
Find the highest-friction moments
Once the baseline is credible, look for where the visitor’s intended decision becomes harder than necessary. Friction is not synonymous with “many fields” or “long page.” It is any unnecessary uncertainty, effort, delay, risk or technical failure between intent and the next useful action.
Combine quantitative and qualitative evidence. Funnel-step loss can point to a location, but it rarely explains why people hesitate. Session recordings, support tickets, sales-call notes, search queries, form error logs, checkout errors, user tests and on-page feedback can generate hypotheses. The goal is not to collect every possible insight. It is to connect observed evidence to a specific behavior you can test.
Separate evidence from the hypothesis
“Users do not trust us” is too broad. “High-intent pricing visitors repeatedly open the security FAQ and abandon before the demo form; moving enterprise security proof beside the CTA may increase qualified form starts without increasing low-quality submissions” is testable.
For each suspected friction point, capture:
- the observed evidence;
- the affected segment and page/step;
- the behavior you think is causing the loss;
- the proposed change;
- the primary metric;
- a guardrail metric;
- effort and implementation risk;
- what result would cause you to learn, iterate or stop.
This structure prevents a backlog from becoming a list of personal design preferences.
Message, proof, CTA and form/checkout design
Most conversion work is a coordination problem between promise, proof and effort. A visitor should understand what the offer is, who it is for, why the claim is credible and what happens after the CTA. Removing friction without clarifying the offer can simply generate more low-quality actions.
For messaging, test specificity before cleverness. State the customer problem, outcome and boundary conditions in language the intended buyer recognizes. For proof, place the strongest relevant evidence near the point of doubt: case evidence near a high-stakes claim, security information near enterprise evaluation, shipping/returns near purchase decisions, and implementation detail near a technical buyer’s CTA.
CTA design should match the stage of intent. “Buy now,” “Start trial,” “Get estimate,” and “Talk to an engineer” are not interchangeable. A lower-commitment CTA can increase clicks while reducing downstream quality if it attracts people who were never likely to complete the business outcome.
Forms and checkout: optimize the whole cost of completion
Every field should have a purpose, but field count is only one variable. Autofill, input type, validation timing, error recovery, password rules, address handling, payment reliability, trust copy and post-submit expectations can matter as much as length. Measure form start, error rate, successful submit and downstream quality separately so the team can see whether a shorter form creates better outcomes or merely more submissions.
For ecommerce checkout, keep revenue, refunds/cancellations and margin visible beside purchase rate. For B2B lead forms, connect submissions to qualification and opportunity status where your CRM process allows it.
Mobile-specific friction
Mobile conversion should not be read as a smaller version of desktop conversion. The device changes context: typing is harder, network quality varies, viewport space is scarce, keyboards cover content, sticky elements compete for attention and accidental taps are easier.
Test real common devices and widths, not only a responsive desktop preview. At approximately 390px, verify that primary content is immediately visible, no page-level horizontal scroll appears, touch targets remain usable, form labels do not clip, validation messages remain next to the relevant control, and sticky navigation does not hide the CTA or error state.
Performance can also become a conversion constraint. Large hero media, client-side scripts, tag managers and third-party widgets may delay the moment when a visitor can understand or act. Measure the actual journey and the most important interactive states, not just a homepage score.
Mobile segmentation changes interpretation
If mobile conversion is lower, do not assume the design is at fault. Mobile traffic may include more exploratory social visitors while desktop receives more branded or returning demand. Compare device within similar intent/source groups before turning the device gap into a redesign mandate.
Segment by source and intent
A blended conversion rate becomes misleading when the site serves multiple jobs. A branded-search visitor looking for pricing is not equivalent to a first-touch visitor reading an educational article. Google Analytics provides session source/medium dimensions precisely because acquisition context matters; your analysis should preserve that context rather than flatten it.
A practical segmentation hierarchy is:
- Intent: high-intent commercial, evaluative, exploratory/educational, support/existing customer.
- Source: branded organic, non-brand organic, paid search, paid social, email, referral, direct and partner traffic as relevant.
- Device: mobile, desktop and tablet when volume supports useful interpretation.
- Audience state: new/returning, customer/prospect, account tier or lifecycle stage when legitimately available.
Avoid slicing until every cell is tiny. The purpose of segmentation is to reveal a decision-relevant difference, not to create dozens of unstable rates. Start with the segments that plausibly have different intent or experience, then drill down when evidence supports it.
Compare like with like
When an experiment runs on a pricing page, compare eligible pricing-page traffic assigned to the experiment—not every site session. When measuring a lead-flow change, consider both submit rate and qualification. When a campaign changes at the same time as a page, annotate it so the team does not over-attribute the resulting movement.
Prioritized experiment backlog
A useful experiment backlog is a queue of evidence-backed hypotheses, not a popularity contest. Each item should say what friction was observed, where it occurs, what change addresses it and how success and harm will be measured.
The decision table above gives a practical format. “Confidence” should mean confidence in the evidence behind the hypothesis, not confidence that the variant will win. “Effort” should include engineering, design, analytics, QA, compliance and operational work—not only how long it takes to change a button color.
Prioritize experiments that have a clear affected population, a meaningful business outcome, credible evidence of friction and a change narrow enough to interpret. Deprioritize tests that bundle many unrelated changes unless the purpose is deliberately testing a complete new experience.
Write the stopping and learning rule before launch
Every experiment should define a hypothesis, primary metric, guardrail and analysis rule before exposure begins. Optimizely distinguishes decision-making/primary metrics from guardrail metrics, and its current documentation describes guardrail alerts for detecting harmful movement against important business metrics. Whatever platform you use, the principle is the same: decide in advance what metric represents the intended improvement and what must not be damaged.
Do not continuously peek at an unstable early result and stop the moment it looks favorable. Follow the statistical method and exposure requirements of your experimentation platform, account for business cycles that matter to the journey, and document inconclusive results as learning rather than forcing a winner.
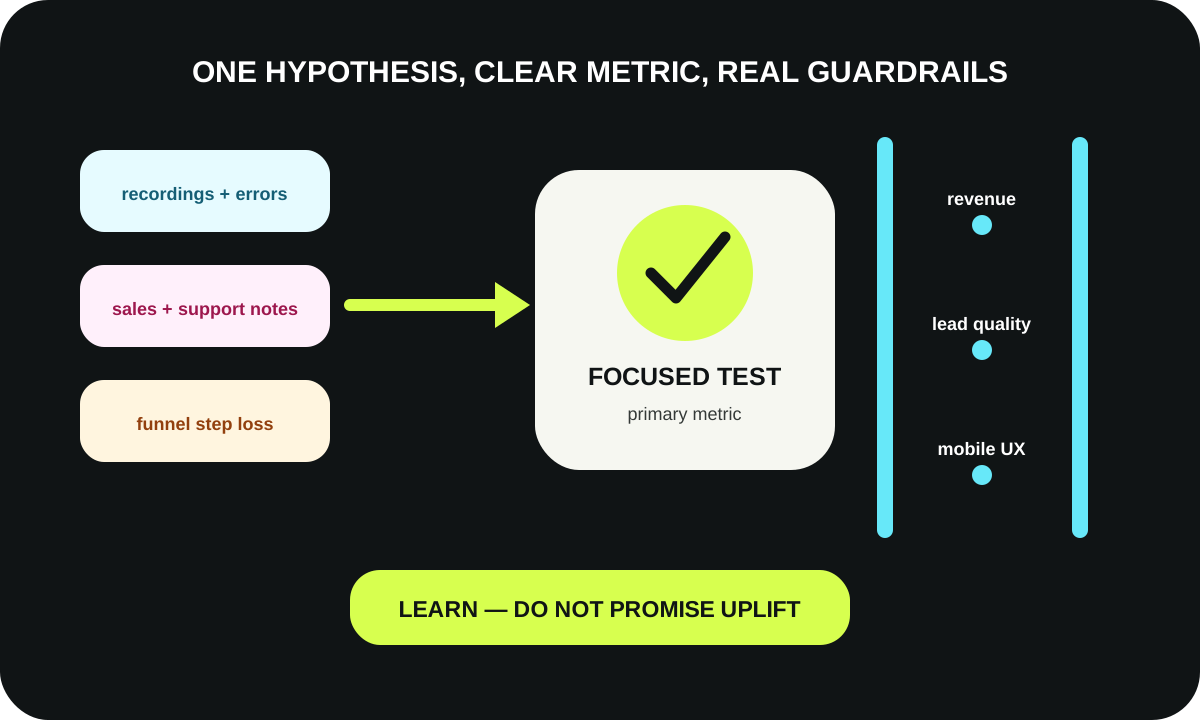
Model revenue impact without promising uplift
A rate change can be translated into a business scenario, but arithmetic is not causality. The calculator above uses only your inputs: eligible traffic/leads, current rate, modeled rate, average order or deal value, and gross margin. It calculates current versus modeled conversions, revenue and gross profit. It does not predict that a page change will create the modeled rate.
The basic model is intentionally transparent:
- current conversions = eligible traffic × current conversion rate;
- modeled conversions = eligible traffic × modeled conversion rate;
- revenue = conversions × average order/deal value;
- gross profit scenario = revenue × gross margin assumption.
For a B2B funnel, average deal value may be too early in the journey. In that case, model through the stage you can defend: qualified leads, opportunities or closed-won revenue using observed downstream rates. Do not multiply a top-of-funnel form increase by average contract value unless the qualification and close assumptions are explicit.
Use scenarios to size importance, not to sell certainty
A scenario can answer “If this segment moved from the observed rate to this modeled rate, what would the arithmetic consequence be?” That helps decide whether an experiment deserves engineering time. It cannot answer “Will this redesign generate $X?” without evidence about the causal effect.
Keep negative scenarios too. If a change increases conversion but lowers average order value, margin or lead quality, the business outcome can be neutral or worse. That is why the tool exposes margin and why the experiment plan needs guardrails.
Measurement and guardrail metrics
A primary metric should represent the behavior the experiment is intended to change. A guardrail should protect an important outcome that might be harmed while the primary metric improves. Secondary metrics explain the mechanism or downstream pattern.
Examples:
- Checkout change: primary purchase completion; guardrails payment errors, revenue per eligible session, refunds/cancellations where timely enough.
- Lead form change: primary qualified-submit rate; guardrails spam/unqualified rate and downstream meeting acceptance.
- Pricing-page message: primary qualified CTA completion; guardrails support burden, cancellation or lead-quality indicators.
- Mobile navigation change: primary task completion for the target path; guardrails error rate, accidental exits and performance.
Optimizely’s current experimentation documentation describes primary/decision metrics and separate guardrail metrics used to watch for damage to critical KPIs. The exact statistical implementation differs by platform, so use the platform’s documented method rather than inventing a universal sample-size or stopping threshold in a blog article.
Instrument the full evidence chain
Keep a measurement spec beside the experiment. Record event names, eligibility, denominator, conversion window, variant assignment, source/device dimensions, CRM joins, exclusions and QA evidence. If the metric definition changes halfway through, annotate or restart the comparison instead of silently merging incompatible data.
For revenue events, preserve value and currency. For leads, preserve qualification status through a privacy-appropriate CRM join. For errors, capture enough technical context to distinguish user hesitation from a broken form or payment flow.
90-day optimization roadmap
A 90-day roadmap should build measurement quality before test volume. The dates are a planning cadence, not a promise that every business will reach statistical conclusions within 90 days.
Days 1–30: define, instrument and diagnose
Write the conversion dictionary, confirm numerator/denominator definitions, validate analytics and CRM joins, establish the segmented baseline, and collect qualitative evidence. Fix obvious technical defects before calling them experiments: broken validation, dead CTAs, mobile overflow, checkout errors, duplicate tracking and inaccessible controls do not need an A/B test to deserve repair.
Create the first backlog from evidence and identify one or two high-value funnel steps. Define primary and guardrail metrics before designing variants.
Days 31–60: run focused experiments and protect guardrails
Launch the smallest interpretable experiments on the highest-evidence friction points. QA assignment, events and revenue/lead-quality tracking before trusting the dashboard. Monitor guardrails and operational signals. Keep campaign or pricing changes annotated because they can change the traffic or offer while the test is running.
For each completed experiment, record the decision, uncertainty and what was learned about the visitor—not only whether a variant “won.” Feed that learning back into the next hypothesis.
Days 61–90: compound learning, not random test count
Scale changes that have credible evidence and no unacceptable guardrail damage. Revisit segments to see whether the effect is concentrated in a device, source or intent group. Improve the measurement spec where experiments exposed blind spots. Retire low-value ideas instead of keeping an endless backlog.
At the end of the cycle, the most useful output is not a new “benchmark conversion rate.” It is a repeatable operating system: a trustworthy baseline, defined segments, a friction evidence loop, disciplined experiments, economic scenario modeling and guardrails tied to real business quality.
For implementation, see the Web Design & Development service, the website redesign checklist, the B2B website redesign strategy, and the AI chatbot vs live chat conversion guide. The Conversion & Growth hub collects related optimization guides.
Frequently asked questions
What is a good website conversion rate?
A good rate is one that is correctly defined for the relevant audience and funnel step, supports acceptable business economics, and can be improved without damaging quality or other guardrails. There is no universal percentage that applies to every website.
Should I compare my site with industry conversion benchmarks?
Use external benchmarks as rough context only. Confirm that the benchmark uses a comparable numerator, denominator, traffic mix, geography, offer and funnel step before treating it as informative.
How do I calculate website conversion rate?
For a defined population, divide the number of qualifying conversions by the number of eligible users or sessions in the denominator and multiply by 100. Keep the scope and window consistent.
Why is mobile conversion lower than desktop?
It may reflect mobile UX friction, but it can also reflect different source and intent mix. Compare mobile and desktop within similar traffic segments before concluding that the device experience is the cause.
Can I estimate revenue from a higher conversion rate?
You can model a scenario by applying a hypothetical rate to eligible traffic and average value, but the result is arithmetic, not a forecast. A test or other causal evidence is needed before claiming the change will produce that rate.
What should an A/B test include before launch?
Define the hypothesis, eligible population, primary metric, guardrail metrics, instrumentation, variant assignment, analysis/stopping rule and QA evidence before exposure begins.